Understanding the Financial Impact of Nitrogen Generation Systems
Investing in an N2 generator represents a significant decision for many businesses, requiring careful evaluation of both immediate costs and long-term benefits. The N2 generator cost encompasses not just the initial purchase price, but a complex web of operational expenses, maintenance requirements, and potential savings that need thorough analysis. Modern industries increasingly recognize the advantages of on-site nitrogen generation over traditional cylinder or bulk liquid supply methods.
The ability to produce nitrogen on-demand has revolutionized various sectors, from food packaging to pharmaceutical manufacturing. However, making an informed decision requires understanding the complete financial picture and calculating the true return on investment (ROI). This comprehensive guide will walk you through every aspect of N2 generator costs and help you make a data-driven decision for your business.
Initial Investment Considerations
Equipment and Installation Expenses
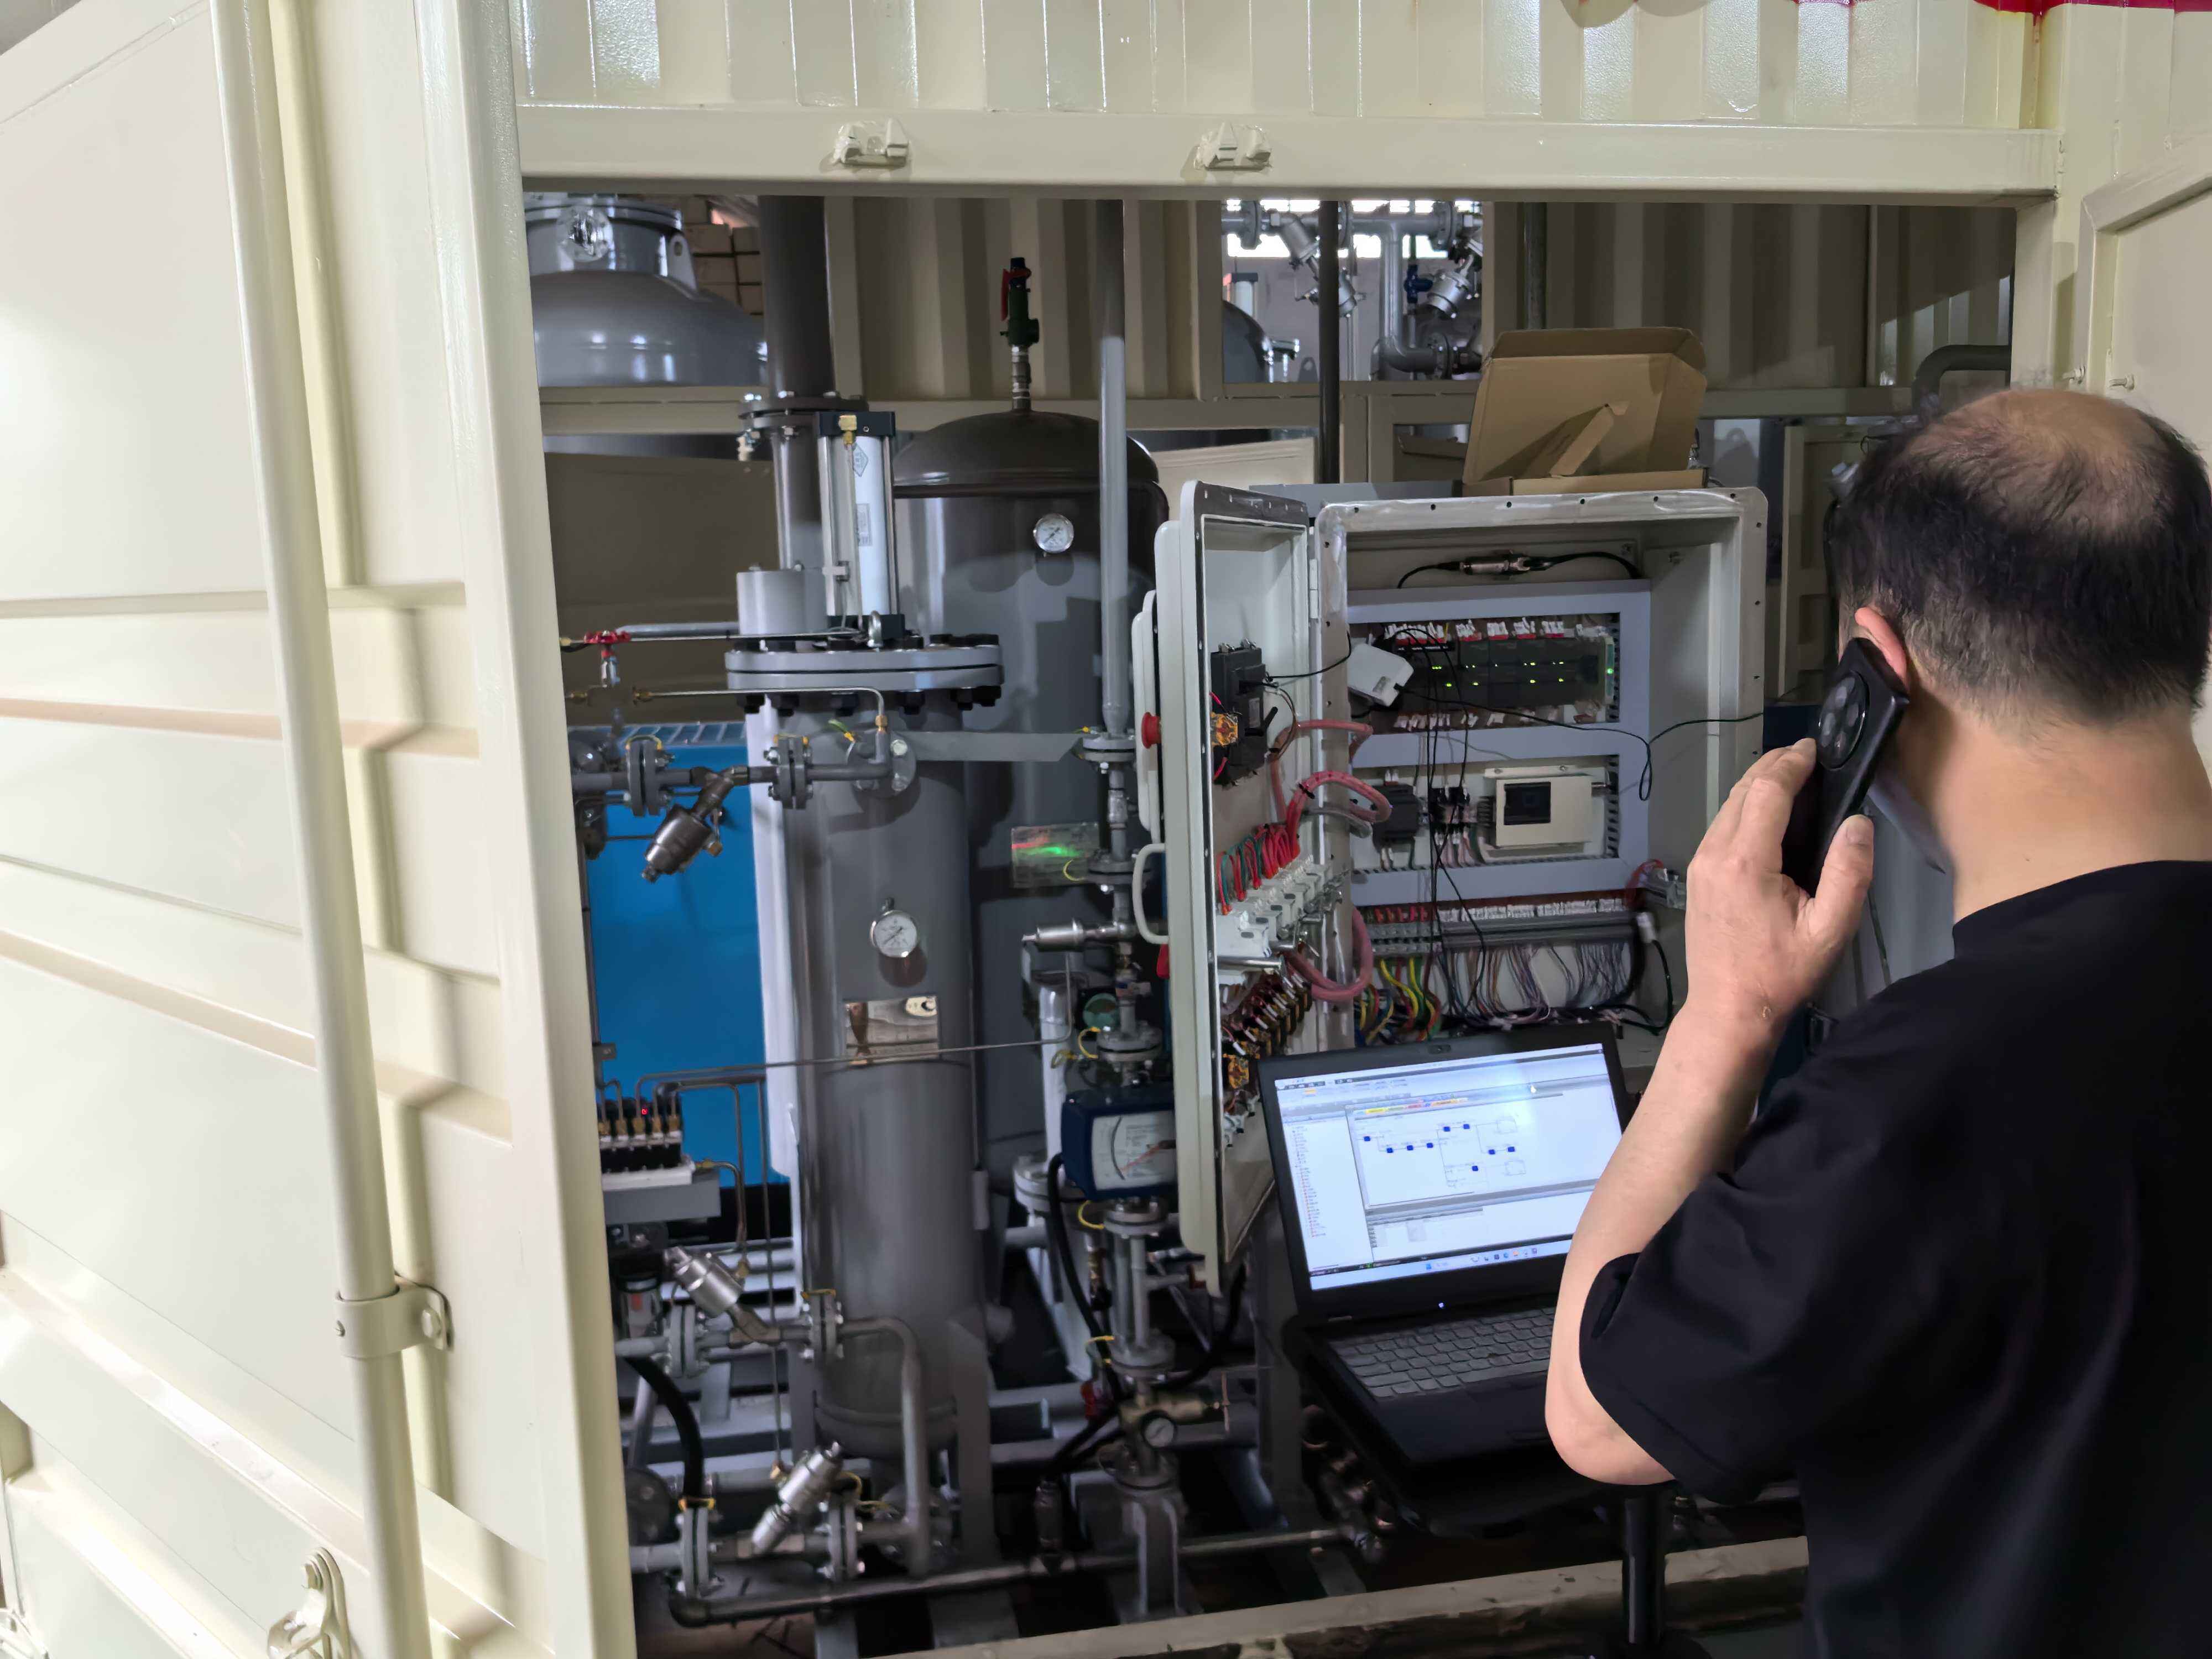
The upfront N2 generator cost typically ranges from $20,000 to $200,000, depending on the system size and specifications. This initial investment includes the core generation unit, compressor systems, filtration components, and monitoring equipment. Installation costs can add another 15-30% to the base price, covering labor, piping, electrical work, and system integration.
Additional infrastructure modifications might be necessary, such as reinforced flooring, dedicated power supply, or specialized ventilation systems. These site preparation costs should be factored into the initial budget to avoid unexpected expenses during implementation.
System Sizing and Capacity Planning
Selecting the right system size is crucial for optimizing N2 generator cost efficiency. Undersized systems may not meet production demands, while oversized units represent wasted capital and operating expenses. Professional flow studies and demand analysis help determine the optimal capacity, typically including a 20-30% buffer for future growth.
Consider peak usage patterns, seasonal variations, and potential expansion plans when sizing your system. Modern N2 generators often offer modular designs, allowing for scalable capacity increases as your needs grow.
Operational Cost Analysis
Energy Consumption Patterns
Power consumption represents one of the most significant ongoing N2 generator cost factors. Modern systems typically require 0.3-0.4 kWh per cubic meter of nitrogen produced. Understanding your facility's electricity rates, including peak versus off-peak pricing, helps forecast operating expenses accurately.
Energy efficiency features, such as variable speed drives and smart controls, can significantly reduce power consumption. Some systems offer energy recovery options, channeling waste heat for other processes and improving overall efficiency.
Maintenance Requirements and Costs
Regular maintenance ensures optimal performance and longevity of your N2 generator. Annual maintenance costs typically range from 2-5% of the initial system price, covering filter replacements, sensor calibration, and preventive servicing. Establishing a comprehensive maintenance schedule helps prevent unexpected downtime and extends equipment life.
Many manufacturers offer service contracts that provide predictable maintenance costs and priority support. These agreements often include regular inspections, parts replacement, and emergency response services.
Long-term Financial Benefits
Cost Savings Over Traditional Supply Methods
Compared to delivered nitrogen, on-site generation can reduce costs by 40-80% over time. The N2 generator cost advantage becomes particularly evident when considering the elimination of delivery charges, rental fees, and price fluctuations associated with traditional supply methods. Most systems achieve payback within 12-24 months of installation.
Additional savings come from reduced storage requirements, eliminated product loss due to evaporation, and improved supply chain independence. The predictable cost structure of on-site generation also helps with accurate budgeting and cost control.
Environmental and Efficiency Gains
Beyond direct financial benefits, N2 generators offer environmental advantages that may translate into monetary gains. Reduced carbon footprint from eliminated delivery trucks, lower energy consumption compared to cryogenic production, and decreased packaging waste all contribute to sustainability goals.
Some regions offer tax incentives or grants for implementing energy-efficient technologies, potentially offsetting the initial N2 generator cost. These environmental benefits also support corporate sustainability initiatives and marketing efforts.
ROI Calculator Components
Essential Metrics for Analysis
A comprehensive ROI calculation must consider multiple variables: current nitrogen costs, projected usage volumes, utility rates, maintenance expenses, and depreciation factors. Modern ROI calculators incorporate these elements to provide accurate payback projections and long-term cost comparisons.
Advanced analysis tools also factor in inflation rates, energy cost trends, and potential carbon pricing impacts. This detailed approach ensures realistic financial planning and helps secure project approval from stakeholders.
Performance Monitoring and Optimization
Continuous monitoring of system performance helps optimize ROI through early detection of efficiency losses or maintenance needs. Modern N2 generators include sophisticated monitoring systems that track production costs, purity levels, and system efficiency in real-time.
Regular performance reviews and data analysis enable continuous improvement in operating efficiency, ensuring maximum return on your N2 generator cost investment. This data-driven approach helps identify optimization opportunities and validate actual savings against projections.
Frequently Asked Questions
What factors most significantly impact N2 generator cost?
The most significant cost factors include system capacity, purity requirements, installation complexity, and local utility rates. Higher purity requirements generally increase both initial and operating costs, while larger capacity systems often offer better economies of scale in terms of production cost per unit volume.
How long does it typically take to achieve ROI on an N2 generator?
Most facilities achieve return on investment within 12-24 months, depending on current nitrogen costs and usage volumes. High-volume users typically see faster payback periods, sometimes as quick as 6-8 months. Factors such as energy costs, maintenance expenses, and utilization rates influence the actual payback period.
What maintenance requirements should be considered in cost calculations?
Regular maintenance includes filter replacements, sensor calibration, and annual servicing. Budget for approximately 2-5% of the initial system cost annually for maintenance expenses. Preventive maintenance programs can help reduce unexpected repairs and extend equipment life, optimizing long-term N2 generator cost effectiveness.

